STRATAQUEST
Your Advanced Analysis Platform for Phenotyping, Quantification, and Spatial Insights
Check out our library of premade analysis workflows, learn more ›
StrataQuest Version 8.0 is Out, Request a Live Demo Now.


StrataQuest Image Analysis
Turns imaging data into publication-ready results.
StrataQuest provides exceptional flexibility for creating custom analysis workflows, making it easy to manage everything from simple image filters to advanced tools for phenotyping, spatial analysis, data mining, and more. This user-friendly platform ensures precise and scalable analyses across a broad spectrum of applications.
Whether you're new to image analysis, requiring assistance, or an advanced analyst looking to optimize your workflow, our expert support is ready to help you in making the most of the platform.
Why choose StrataQuest?
StrataQuest is a powerful image analysis solution capable of tackling even the most complicated research questions. It is a trusted platform designed to deliver you data from slide to insight.
Customize your Analysis Workflows
Mix simple tools and advanced engines to match any experiment or expertise level.
Understand Spatial Context
Measure distances and map cell neighborhoods with advanced spatial tools built for deep tissue insights.
Visualize Complex Data
Explore and visualize complex datasets with integrated tools like t-SNE, UMAP, SONG, and Violin Plots, directly within the software.
Support That Knows Science
Our support team is here to guide you through building and optimizing analysis pipelines - and develop custom solutions upon request.
What’s New in StrataQuest 8.0?
Smarter insights. Smoother workflows. Stronger science.
Explore the newest features designed to accelerate discovery—from powerful data mining tools to a redesigned, more intuitive workspace.

Advanced Data Mining Tools
- Apply t-SNE, UMAP, and SONG for intuitive dimensionality reduction
- Visualize hidden relationships between phenotypes
- Use violin plots to compare marker expression across multiple phenotypes
- Reveal trends in marker expression, staining intensity, or spatial distribution
Phenotypes & Interactions
- Define complex phenotypes using Boolean logic (e.g., CD3+CD8+PD1–)
- Visualize and track phenotypes across all diagrams
- Analyze spatial interactions between phenotypes
- Gain insight into immune infiltration, cell clustering, and proximity behavior
Redesigned User Interface
- Improved Layer Editor for better overview
- Image & Category Toolbar for seamless verification
- Object Inspector with clearer raw data access
- Customizable workspace with draggable panels
- New Project Database view with thumbnails, markers, and slide previews
- Integrated Bio-Formats import for wider compatibility
Want a guided tour of SQ8?
Key features of StrataQuest
- Phenotyping and Phenotype Interactions
- Dot Detection
- AI Nuclei Segmentation
- AI Tissue Classification
- Prebuilt Pipeline Library
- Proximity Measurement
- Data Mining Tools
- Unlimited Multiplexing
- Custom Statistics
- Versatile Data Export
- Interactive Diagrams
- Real-time Analysis Preview
- Omics Explorer


Now Easier Than Ever in StrataQuest 8.0!
Phenotyping and Phenotype Interaction
The Phenotyping tool with intuitive marker selection (e.g., cells positive for markers X and Y, but negative for Z) allows for quick and easy definition of cellular subpopulations. These phenotypes can be easily displayed on the image and in diagrams (e.g. t-SNE plot).
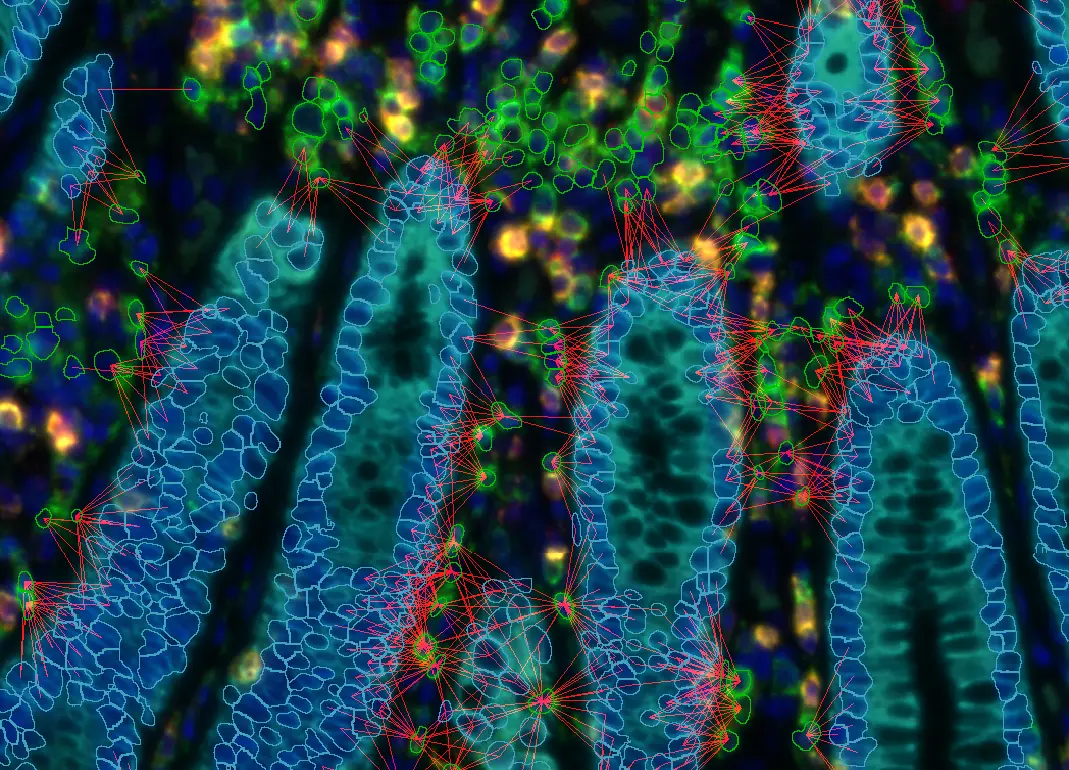
Study the relationship between cellular phenotypes and precisely assess their neighborhoods with the phenotype interaction tool. Simply select the phenotypes of interest, define the desired maximum distance in μm, and let the algorithm analyse potential interactions.


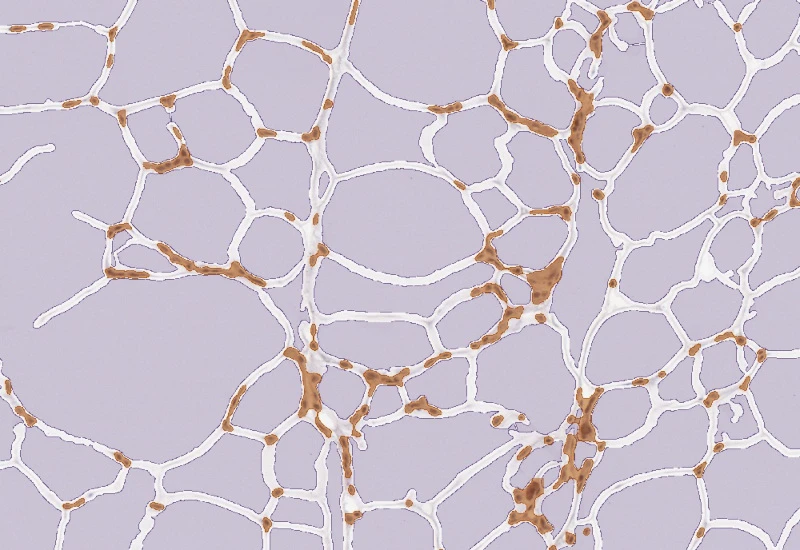
Dot Detection
Perform in-depth analysis of staining patterns within individual cells, including dot patterns such as FISH or CISH. The software also facilitates visualization of dots per cell and co-expression analysis across multiple color channels, providing detailed insights into cellular phenotypes.


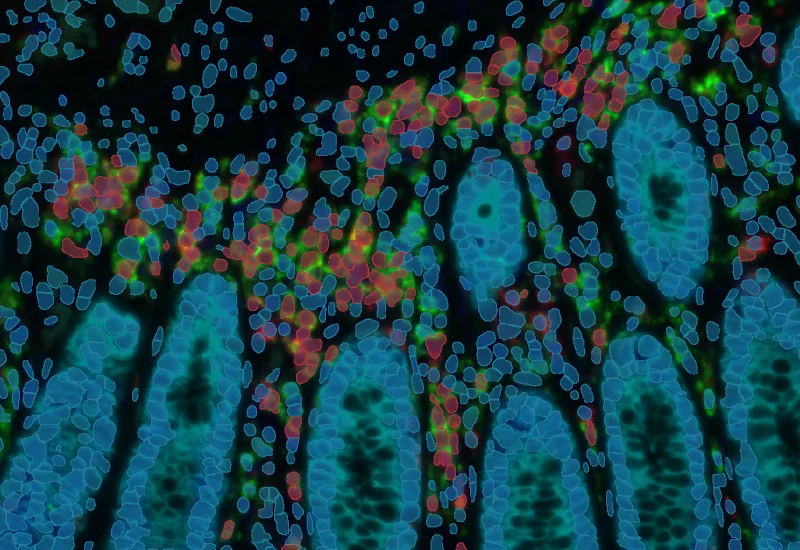
AI-based nuclei segmentation
For nuclei segmentation, depending on the tissue, choose either the classical or the deep learning based approach. For challenging tissues, e.g. weakly stained or densely packed nuclei, the deep learning based segmentation algorithm was developed to ensure accurate detection.


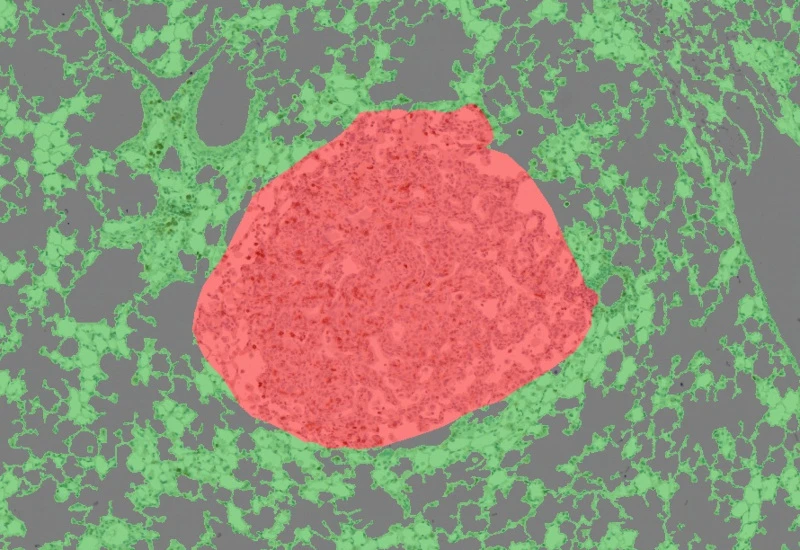
Machine-learning based tissue classification
Train the classification engine by drawing lines on the corresponding tissue areas to detect and distinguish macrostructures within a sample. The classifier training output highlights different regions: e.g. crypts in red, stroma in green, and background in grey. This segmentation enables clear differentiation of histological structures.
Coming in 8.1: The new AI Center will introduce a platform for training, management and storage of deep learning and machine learning models within StrataQuest. This tool allows users to quickly fine-tune powerful AI models using their own annotated data, without needing to switch between multiple tools.

Over 70 apps
Library of Prebuilt Pipelines
Access a large selection of ready-to-use analysis pipelines (Apps) developed for various applications (e.g. osteology, neurology, oncology, immunology, dermatology, and more), or custom development from scratch.

Proximity measurement tool
Analyse distribution patterns of phenotypes within specific distances from tissue structures such as tumor islets. The distance map output can also be visualized graphically, with customizable distance ranges. This visualization includes a backward link to the original images, allowing users to easily cross-reference and visually confirm data in the context of tissue structure, enhancing both accuracy and interpretability of spatial distribution.

New in StrataQuest 8.0!
Data Mining and Exploration Tools
Access a suite of data mining diagrams to elevate your interpretation of complex datasets. Select t-SNE, UMAP, and SONG with one click to reveal hidden relationships between cell phenotypes by mapping similarities in staining intensity, cell size, and other features in an intuitive 2D space. Use 3D diagrams to explore the distribution of three phenotypes along x, y, and z axes, and illustrate distribution patterns with violin plots to compare marker expression across multiple cellular phenotypes simultaneously.

Unlimited Multiplexing
Whether you're working with low-plex or high-plex datasets, StrataQuest delivers accurate, reproducible results that reveal deeper insights into cellular behavior, spatial organization, and phenotypic distribution. With no fixed limit on the number of markers you can analyze, it enables comprehensive, multiplexed analysis within a single sample - further, integrated data mining tools help you to make sense of complex high-plex data.
Customized Statistics and Batch Analysis
Tailor the statistical output of your experiment to meet your exact requirements. Adjust the analysis workflow to analyse the samples in batch. Save your custom settings and automate the process, ensuring consistent and efficient analysis every time, without manual adjustments.

Versatile Data Export
Export cell/tissue measurement data, overlays, images, image masks and diagrams in various formats (jpg, tiff, bmp, png). Generate comprehensive statistical reports or export measurements as data tables format for further exploration (e.g. Excel or CSV).
Expanded in StrataQuest 8.0!
Interactive Diagrams
Perform detailed analysis of staining patterns within individual cells, including complex dot-based techniques like FISH and CISH. StrataQuest 8 enables intuitive visualization of dots per cell and co-expression across multiple markers, delivering deep insights into cellular phenotypes.
Version 8.0 introduces integrated tools for high-dimensional data exploration, including t-SNE, UMAP, SONG, and Violin Plots.
All plots are forward- and backward-connected, allowing users to track individual cells across diagrams and back to their spatial context in the tissue.

Even more parameters will be covered with version 8.1
Real-time Analysis Preview
Parameter adjustments appear instantly in a 512x512-pixel preview, minimizing trial and error, enhancing analysis accuracy, and speeding up workflows — all with immediate visual feedback.

Coming in 8.1:
Omics Explorer
StrataQuest enables the import and analysis of different multi-omics platforms MERFISH (Vizgen), 10x Genomics and NanoString experiments. Correlate spatial gene expression, proteins, and morphological features in a single platform by linking omics results with image data and StrataQuest analysis results.
StrataQuest Configurations
Compare base configurations and available upgrade paths.
Target Group | Description | Licensing | Modus | ||
|---|---|---|---|---|---|
StrataQuest Plus | Researchers with multiple research projects, core facilities | Create unlimited pipelines for all your projects or design Apps for simplified high-throughput tasks. | Perpetual or annual license | Maximum flexibility | Can be purchased additionally |
StrataQuest App Platform | Labs relying on standard protocols, technical staff | Simplified user interface with parameters for fine tuning. Fixed diagrams and data export. | Apps individually or in packages; Perpetual license; Price depends on complexity | One specific workflow per App | Only works with Apps |
StrataQuest Analysis Service | Labs out-sourcing small batch image analysis | We do the work, you get the data! Scanning can be included. Please get in contact for further details. | Price = complexity times the number/type of samples | One/multiple Predefined Analysis Tasks | Workflow can be purchased as an App |
Explore the App Center
Explore our StrataQuest Apps and discover a wide range of biomedical image analysis solutions to inspire your research. If you don’t find the perfect fit for your needs, reach out to us — Our team of application experts are happy to support you by developing custom Apps tailored to your unique analysis requirements.
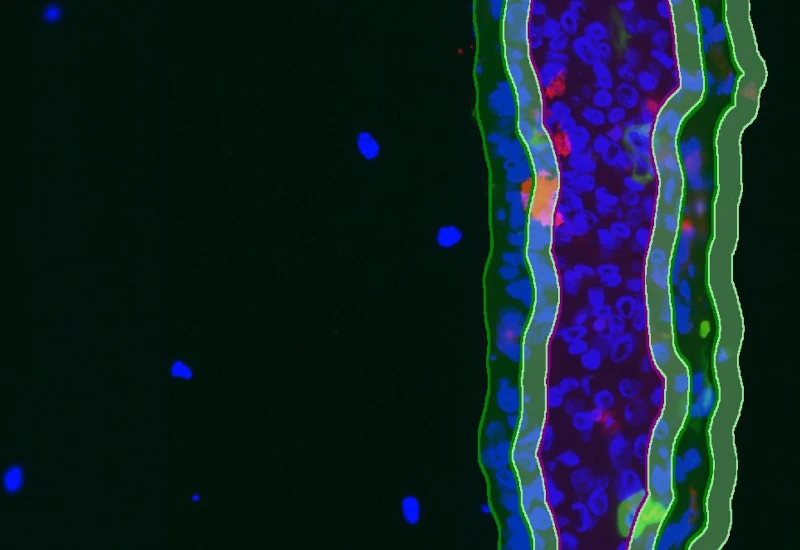
IF Artificial Skin
Stratify skin equivalents into dermis and epidermis, segment the stratum corneum, high/low suprabasal and basal layers, and quantify staining intensity, area, nuclei, and number/% of marker-positive cells for each layer.
metastructures
single-cell analysis
dermatology
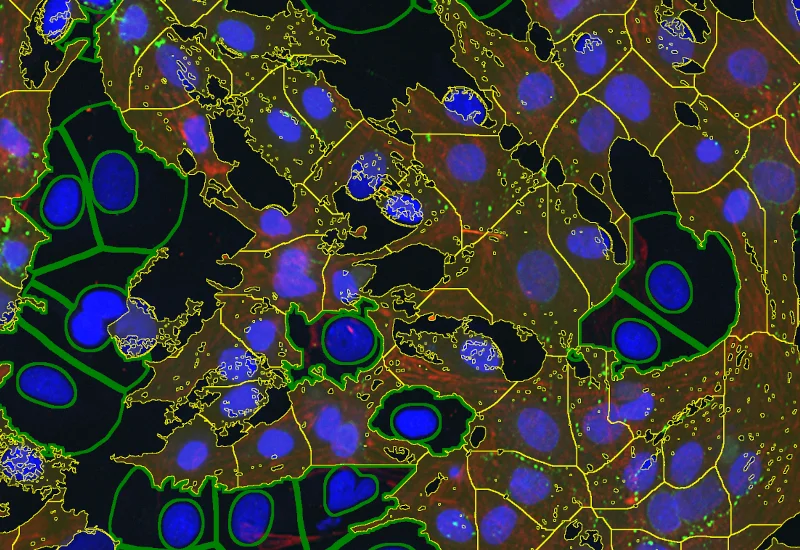
IF Cardio Cell Culture Dots
Segment cultured cardiac cells, detect cardiomyocytes and fibroblasts, and quantify dot markers (CISH/FISH) per cell, including cell counts and dot number, area, and mean intensity.
intracellular analysis
single-cell analysis
neuroscience
cell culture

IF Brain App
Classify brain regions using an AI-based classifier and detect cellular phenotypes (e.g., astrocytes) based on markers, quantify tissue areas, total cells, and phenotype counts across regions.
metastructures
single-cell analysis
neuroscience
IF 4
Analyze single-cell co-expression of four IF markers, segment cells into nucleus, perinuclear area, and/or cytoplasm, and export up to 20 intensity, statistic, and morphometric parameters.
single-cell analysis
tumor microenvironment
multiplex IF
immunophenotyping
IHC Adipocytes+
The IHC Adipocytes+ App detects adipocytes and cellular aggregates between them. Outputs include number and area measurements for adipocytes and aggregates.
single-cell analysis
IHC Lung Cancer Mouse
Segment murine lung sections into tumor and non-cancerous tissue using a machine learning classifier, detect hematoxylin-stained nuclei, and quantify tumor area and marker-positive cellular phenotypes.
metastructures
single-cell analysis
tumor microenvironment

Custom App development
Perfectly tailored image analysis solutions for your research.
You have a specific research question that needs to be answered? We offer custom development of image analysis pipelines for specific tasks, be it detection of cellular phenotypes or quantification of tissue structures. After discussing your goals with one of our experts, you will get a ready-to-use App and be a step closer to an impactful publication.
Explore StrataQuest in Action
Our knowledge base of resources - white papers, application notes, and webinars - provides valuable examples where StrataQuest is already being employed to push science forward.

A glimpse into StrataQuest 8 features: Neighborhood analysis in colorectal cancer

Algorithmic automation of bone research with StrataQuest

Analysis of organoid and immune cell co-cultures with machine- learning-powered image analysis
Experience the power of StrataQuest firsthand with a free demo!
Simply upload your images and let us show you how our advanced analysis tools can transform your research.
Let’s Optimize Your Image Analysis Workflow
Tell us about your project, and we’ll help you find the matching Apps—or schedule a personalized demo.
Whether you're analyzing brightfield, fluorescence, or high-content 3D data, our team will help tailor a StrataQuest solution to match your imaging and analysis needs. From software modules to integration with TissueFAXS systems, we’ll help you build a setup that performs today and scales with your research tomorrow.
Trusted by Researchers
Over 3,200 publications using TG solutions
Researchers worldwide rely on TG imaging and analysis platforms to generate high-quality, reproducible data across a wide range of fields—from oncology and immunology to neuroscience and regenerative medicine.
