IHC Immune Status in Situ
Segment tissue into tumor, stroma, and lymphocyte clusters using an AI classifier, detect hematoxylin-stained nuclei and immune phenotypes (e.g., CD45, CD3, CD20), and quantify spatial immune distribution.
bladder cancer, CD45, immune cells, tumor immune microenvironment, tertiary lymphoid structures, spatial analysis
The IHC Immune Status in Situ App is segmenting the tissue sections in morphological entities such as tumor, stroma and lymphocyte clusters using the AI Classifier. It furhter identifies single cells based on nuclei staining (hematoxylin) and detects immune cells based on appropriated stains (CD45, CD3, CD20 etc.). It also measures the distance of detected objects to the metastructure boundary, distance ranges can be defined. The App outputs parameters including area of the detected morphological entities, number/percentage of lymphocytes detected with the tissue entities as well as in certain proximities of the entities.
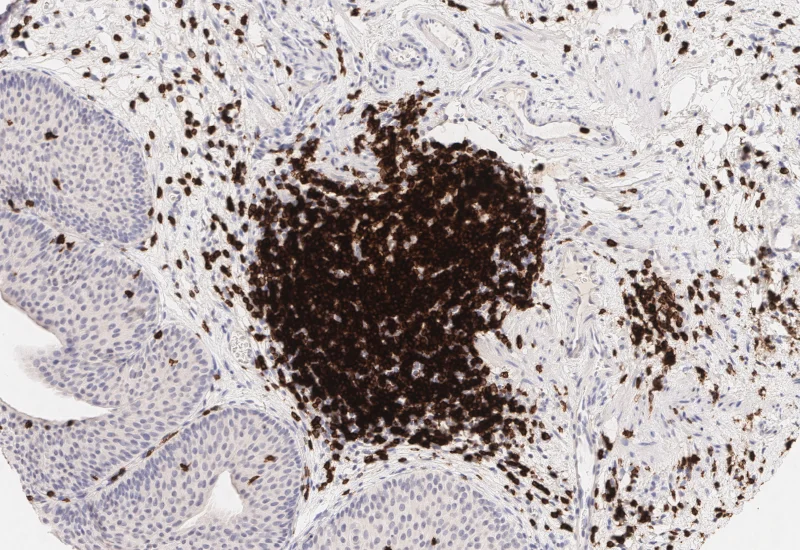
Original Image
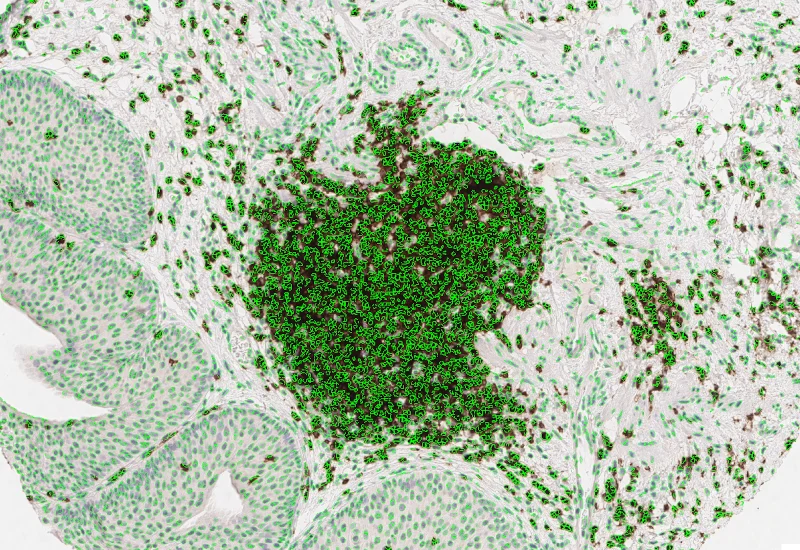
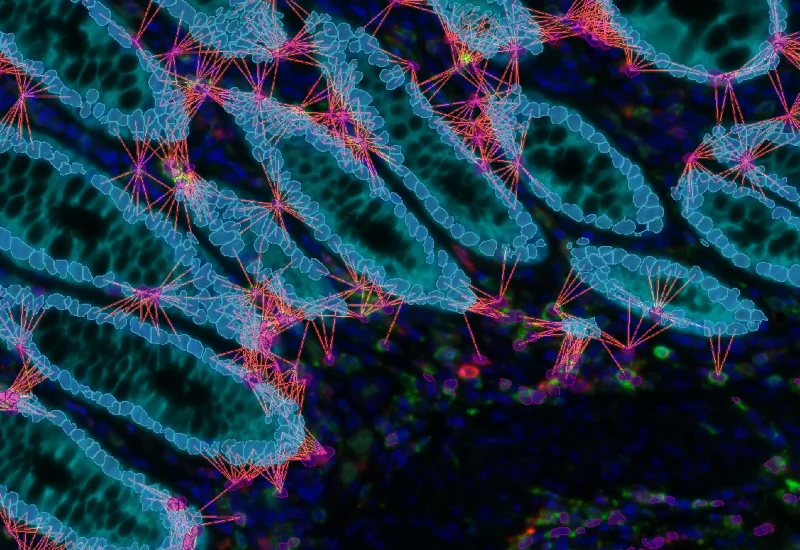
Nuclei detection
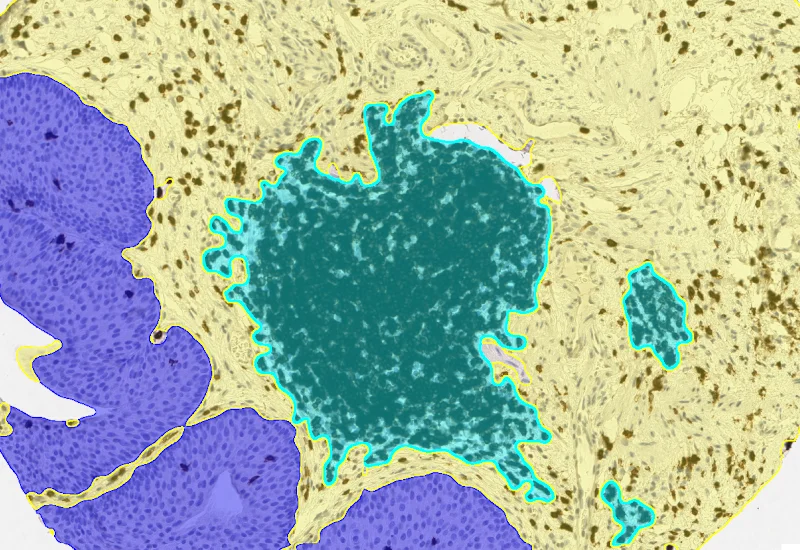
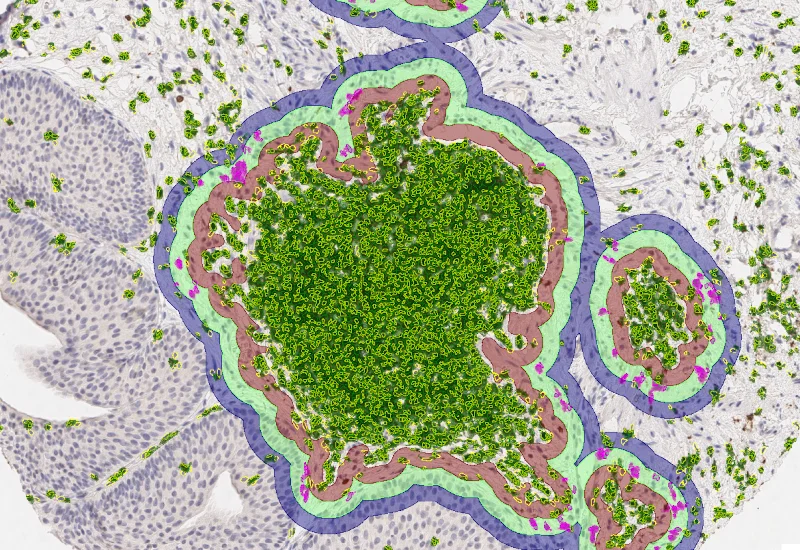
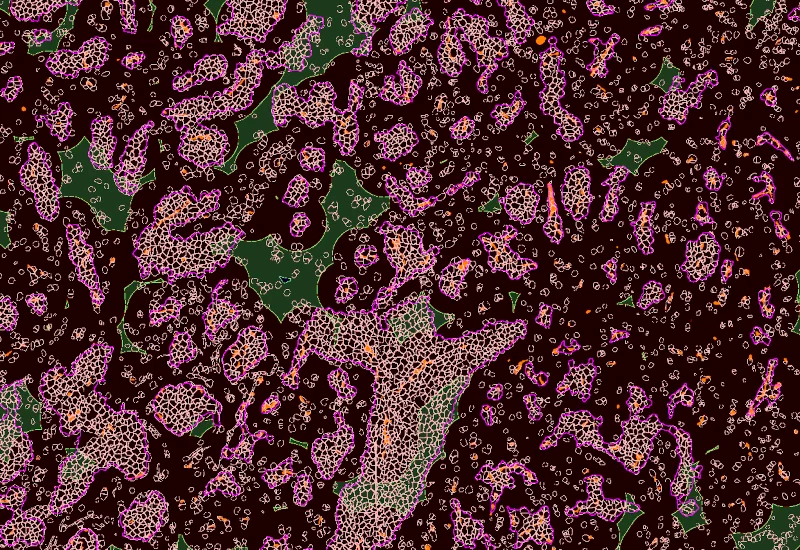
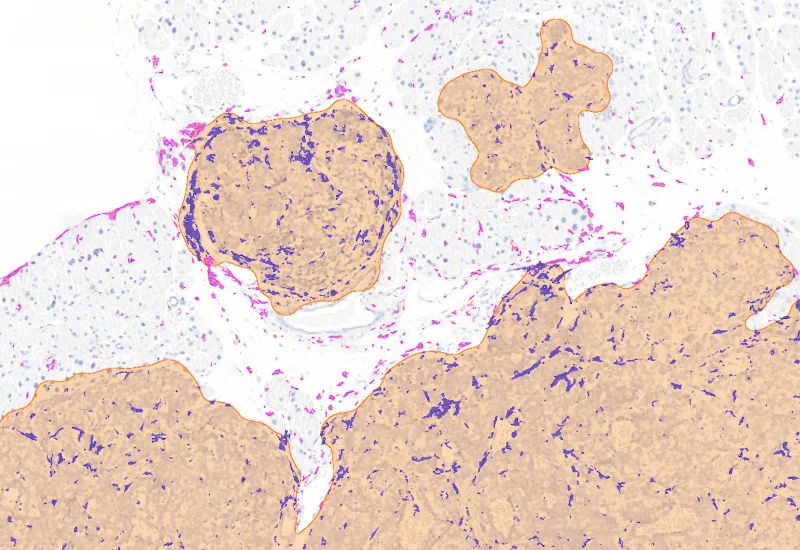
Tumor/Stroma/lymphoid cluster detection
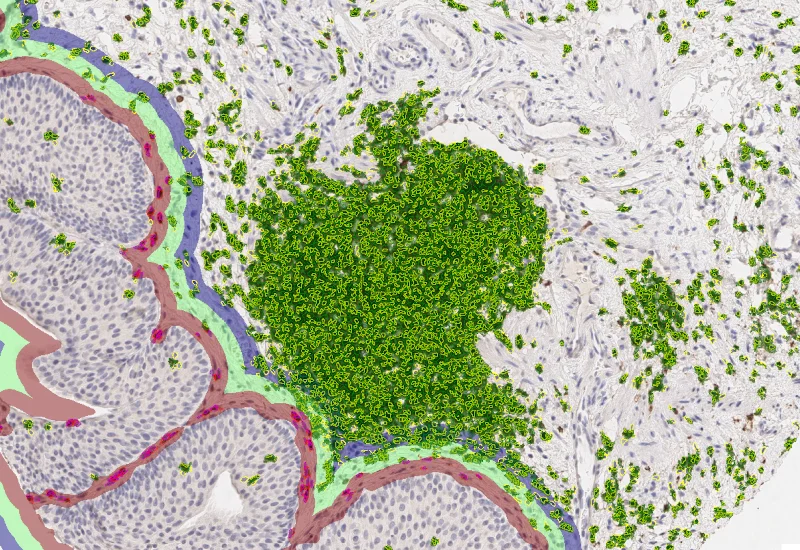
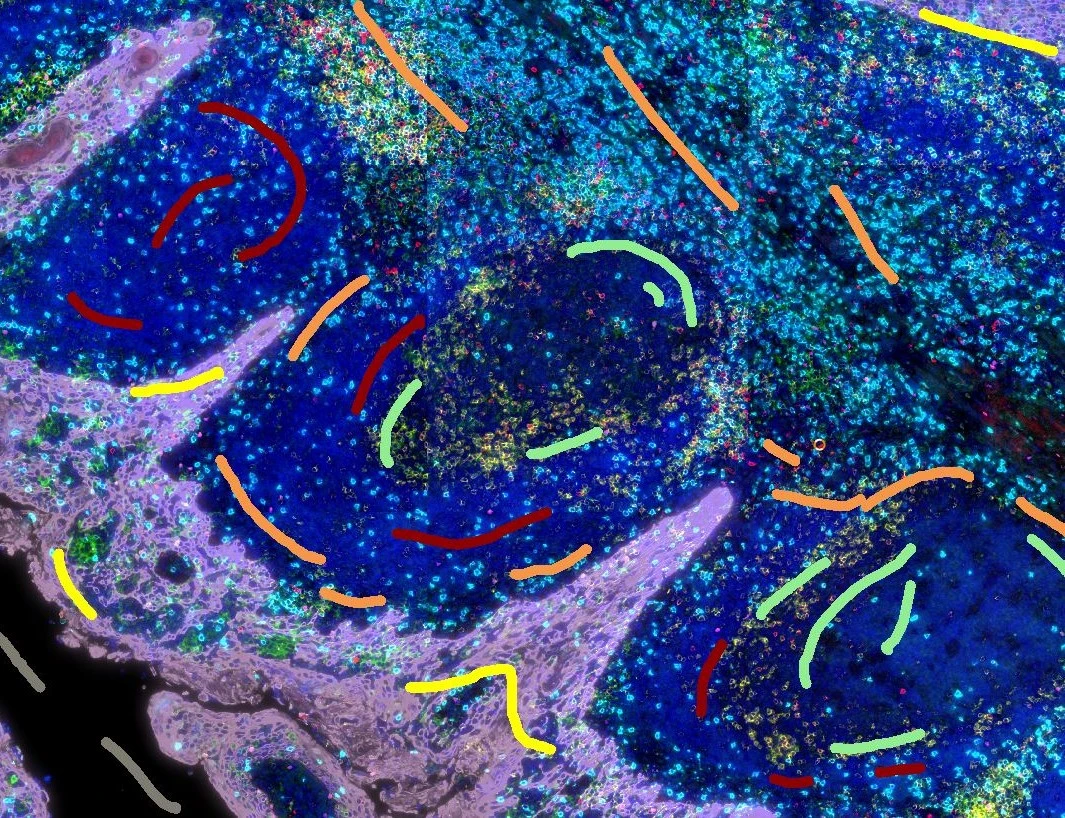
Proximity map tumor
Proximity map lymphoid cluster
The IHC Immune Status in Situ App allows users to adjust tissue classification, cell detection, phenotype gating, and spatial analysis parameters:
- Color separation: Auto-detect or manually define Hematoxylin and DAB markers.
- AI classifier: Segment ROI/sample into Tumor, Stroma, and Lymphocyte Clusters; retrain classifier using manual annotations if required.
- Tissue metastructures filtering: Remove macrostructures (Tumor, Clusters, Stroma) smaller or larger than defined area thresholds (µm²).
- Nuclei detection: Select input image, adjust nuclei size, configure background threshold, and remove nuclei by area or intensity.
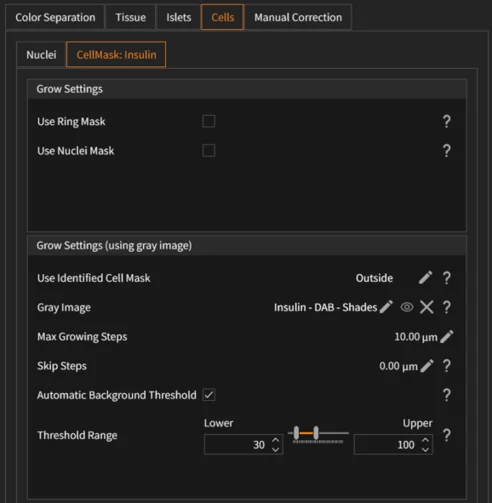
- Cellular mask (immune marker channel): Generate cytoplasmic masks on the DAB channel; define automatic/manual background threshold, threshold range, max growing steps, and interior/exterior growth radius.
- Phenotype gating: Define cutoffs in area–intensity plots (Cellular Mask DAB mean intensity vs. area) to select positive immune cells.
- Proximity distances: Define customizable distance intervals (µm or pixels) to calculate immune cell distances outside Tumor and outside Lymphocyte Clusters.
- Manual correction: Add/Delete Tumor, Stroma, or Clusters using interactive drawing tools.
The app provides quantitative measurements at tissue, cellular, and spatial levels:
- Morphological entities: Area (µm²) of Tumor, Stroma, and Lymphocyte Clusters.
- Total cells: Number of detected nuclei per ROI/sample.
- Immune phenotypes: Number and percentage of DAB-positive immune cells (e.g., CD45+, CD3+, CD20+) in whole tissue and within each morphological entity.
- Cluster quantification: Number and area of Lymphocyte Clusters.
- Spatial analysis: Number and percentage of immune cells within defined distance ranges outside Tumor and outside Clusters.
- Intensity metrics: Cellular mask area and mean intensity on the DAB channel.
- Statistics export: ROI/sample-based reports via the Statistics Report tool.
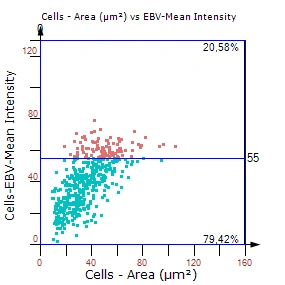
Fig.1: Example plot
Webinar
21 Oct, 2025
Multimodal Imaging of Cellular Senescence: Tissue Cytometry and Beyond
White Paper
17 Oct, 2025
Integrative Multiomics Approach Unveils Systemic Dysfunction in Colorectal Cancer (CRC)
White Paper
17 Oct, 2025
Integrative Multiomics Approach Unveils Systemic Dysfunction in Colorectal Cancer (CRC)
Blog Post
17 May, 2023
An Intro to Deep Learning in Biomedical Imaging
We support the following file formats:
- TissueFAXS (aqproj)
- StrataFAXS II (vmic)
- PreciPoint (vmic, gtif)
- Generic BigTIFF Import
- Support for multipage BigTIFF files
- OME-TIFF
- JPEG, PNG, BMP, TIFF
- Zeiss (czi)
- Hamamatsu NanoZoomer (ndpi)
- Aperio (svs)
- Leica (scn)
- 3D HISTECH Pannoramic
- Mirax (mrxs)
- Olympus (vsi)
- More slide scanners to be added!
Related Apps
IF Cellular microenvironment
Determine phenotypes of specific IF-stained cell populations, analyze spatial relationships to neighboring cells and metastructures (e.g. vessels, tumors), and perform proximity and infiltration analyses.
phenotyping, phenotype interactions, proximity map, spatial landscape, immune cells, tumor, colon cancer, TMA, Foxp3, CD4, CK, PD-1, T regulatory cells, fluorescence

Custom App development
Perfectly tailored image analysis solutions for your research.
You have a specific research question that needs to be answered? We offer custom development of image analysis pipelines for specific tasks, be it detection of cellular phenotypes or quantification of tissue structures. After discussing your goals with one of our experts, you will get a ready-to-use App and be a step closer to an impactful publication.