IF Spatial Dots
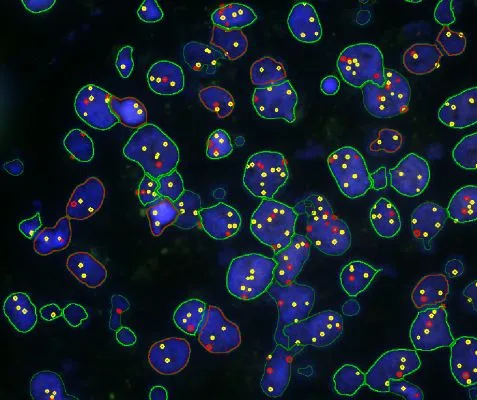
Perform spatial analysis of dot-like signals (e.g., FISH, RNAscope) within nuclei, quantifying nuclei area, dots per nucleus, and dot distribution by direction and proximity.
FISH, cell culture, RNAScope, spatial analysis, proximities, nuclei orientation
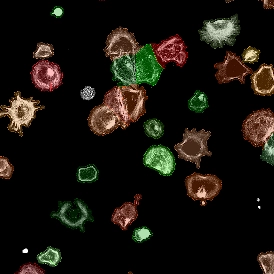
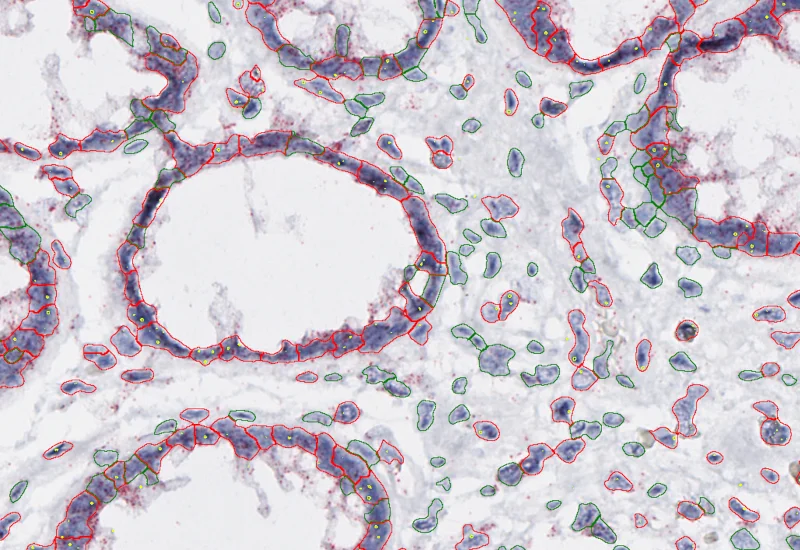
The IF Spatial Dots App allows in-depth spatial analysis of dot-like stainings (FISH, RNAScope etc.) within nuclei. It outputs the number and area (µm2) of nuclei, number of detected dots per nuclei, number/% of dots per nuclei direction and proximity.
Irina Milisav
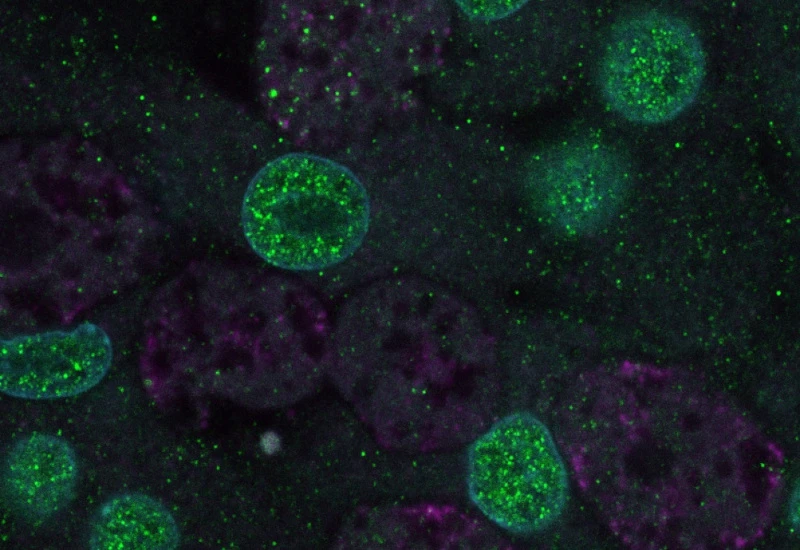
Original image
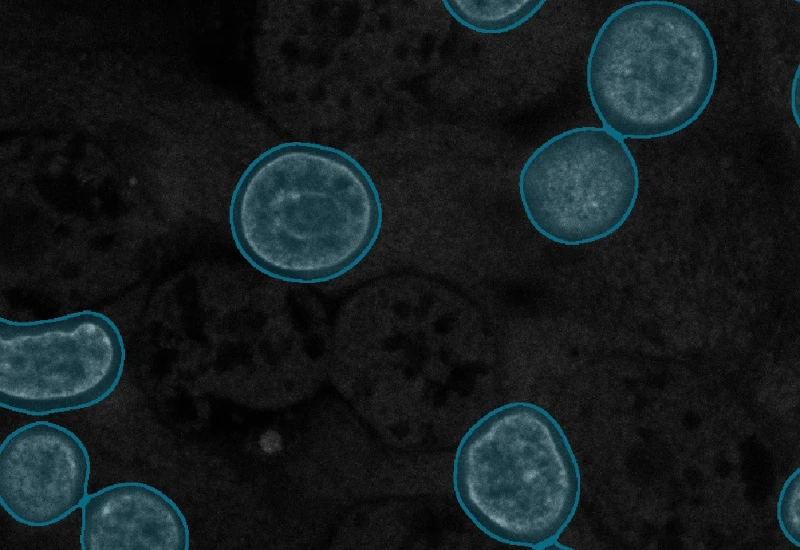
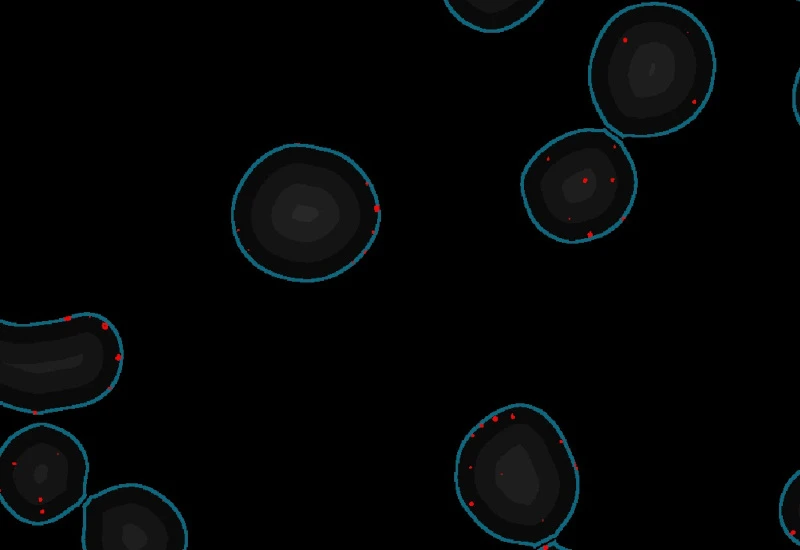
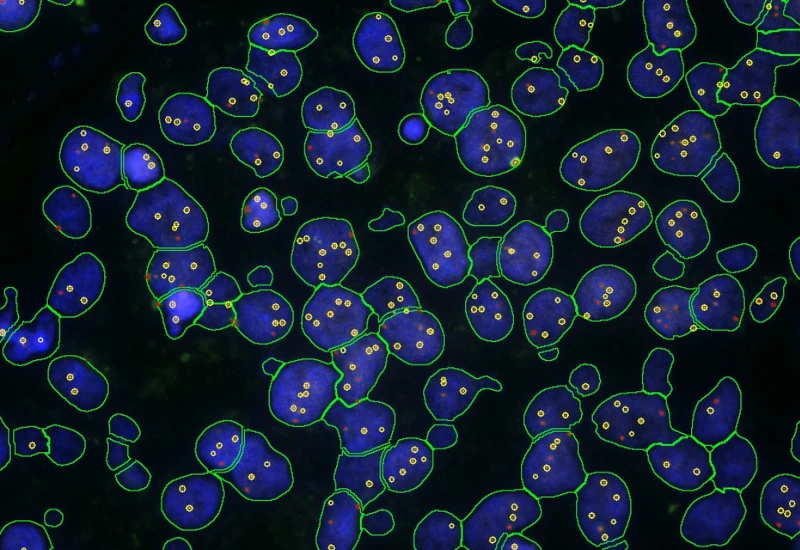
Nuclei detection
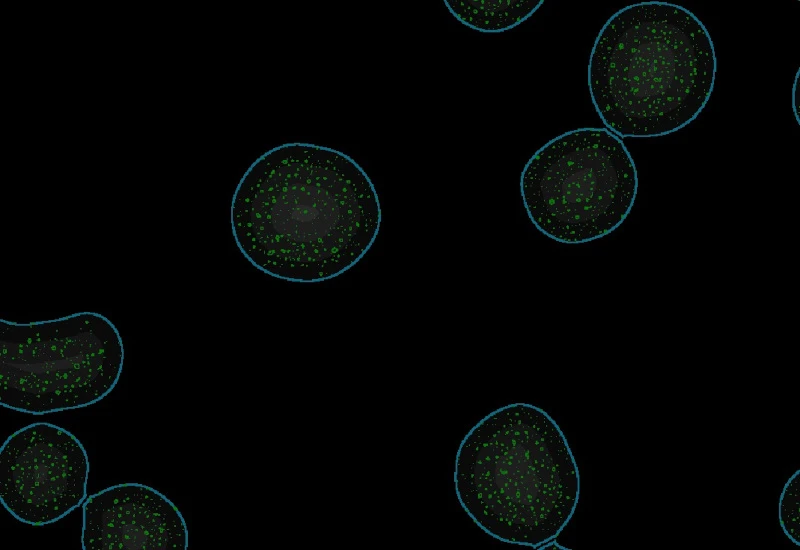
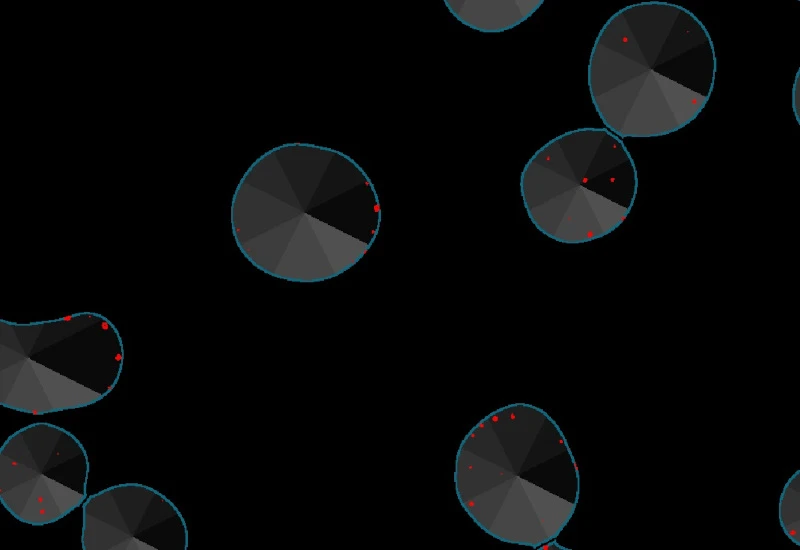
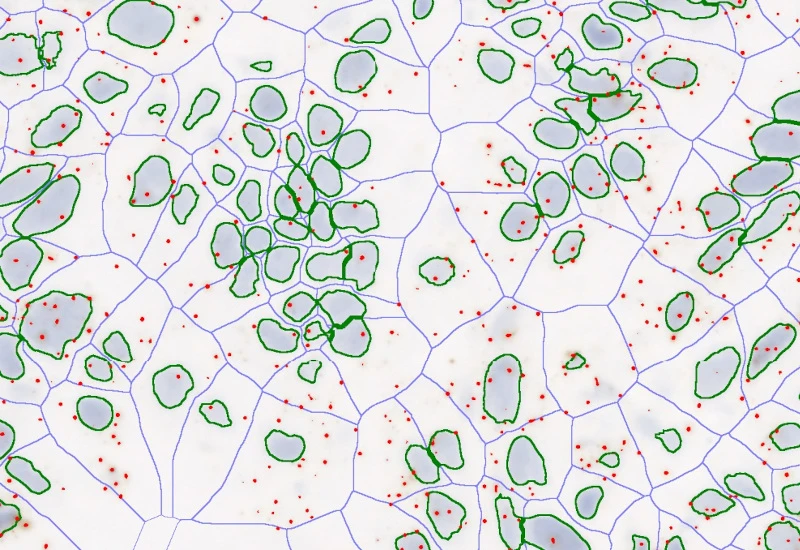
Proximity map of detected dots
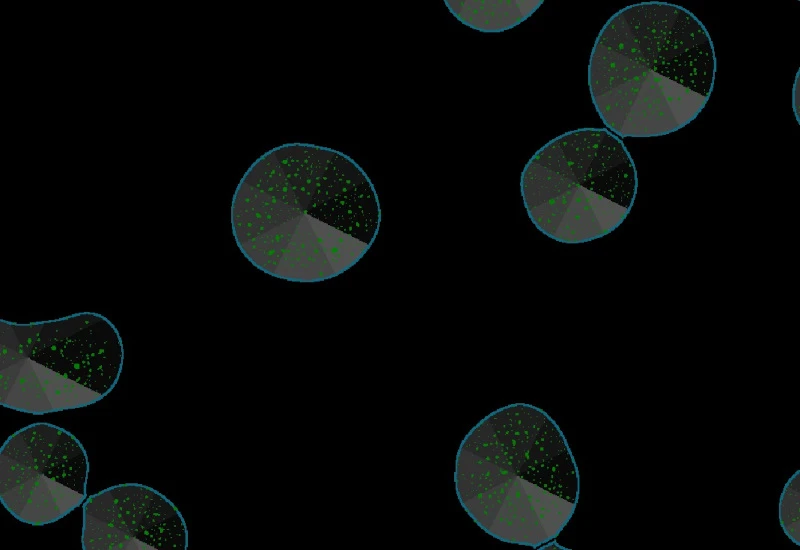
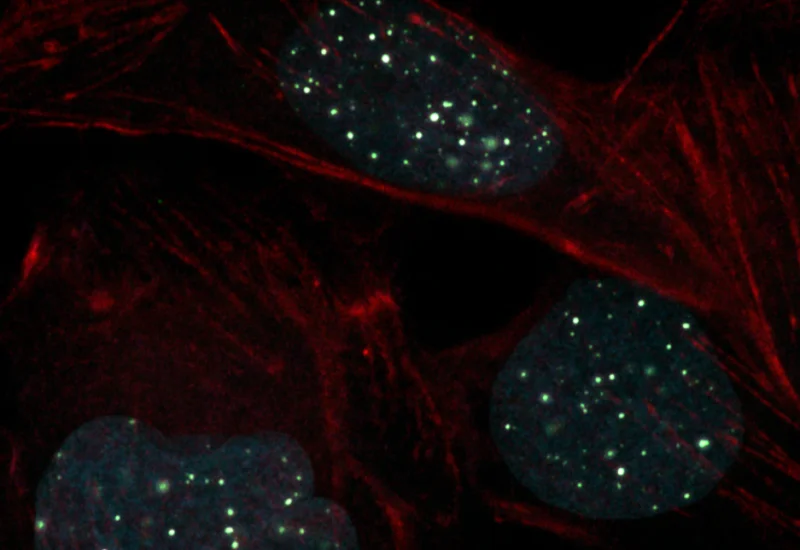
Direction estimation of detected dots
Customer Publication
12 Oct, 2021
Tissue Cytometry in HIV Research
Application Note
14 Feb, 2023
Case Study: Analysis of FISH Using Tissue Cytometry
Blog Post
15 Feb, 2023
Applications of AI in Cell Segmentation
We support the following file formats:
- TissueFAXS (aqproj)
- StrataFAXS II (vmic)
- PreciPoint (vmic, gtif)
- Generic BigTIFF Import
- Support for multipage BigTIFF files
- OME-TIFF
- JPEG, PNG, BMP, TIFF
- Zeiss (czi)
- Hamamatsu NanoZoomer (ndpi)
- Aperio (svs)
- Leica (scn)
- 3D HISTECH Pannoramic
- Mirax (mrxs)
- Olympus (vsi)
- More slide scanners to be added!
Related Apps
IF Dots
Detect dots-stainings per cell in up to four markers, segment cellular compartments, measure up to 20 intensity, statistic, and morphometric parameters, and quantify dot count, mean intensity, total area, intensity sum, and per-dot area/intensity per compartment.
cell culture, breast cancer, fluorescence, HER2
IF Dots Colocalization
Detect dot-like signals (e.g., FISH, RNAscope) in multiple fluorescence channels and quantify dot number, size, and colocalization between markers.
FISH, cell culture, RNAScope, colocalization
Custom App development
Perfectly tailored image analysis solutions for your research.
You have a specific research question that needs to be answered? We offer custom development of image analysis pipelines for specific tasks, be it detection of cellular phenotypes or quantification of tissue structures. After discussing your goals with one of our experts, you will get a ready-to-use App and be a step closer to an impactful publication.