


IF Dots APP: FISH
This example shows how the IF Dots APP can be applied to FISH evaluations. The APP can also be applied to any analysis of dot sized objects, in conjunction with all other StrataQuest features. For FISH evaluation the recommended workflow is to run the dot algorithm on all dot stainings and the to select suitable nuclei by their large size and high compactness.
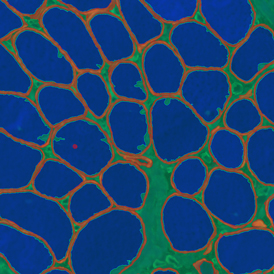
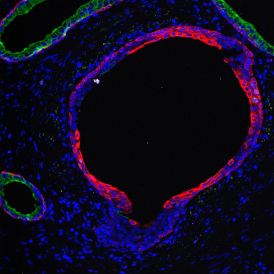
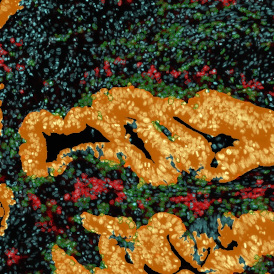
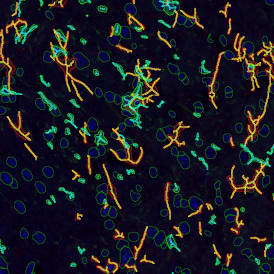
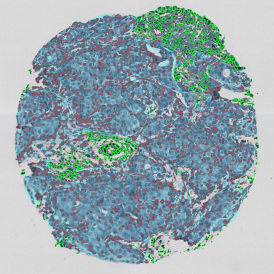
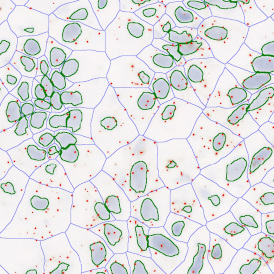
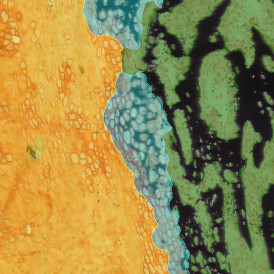
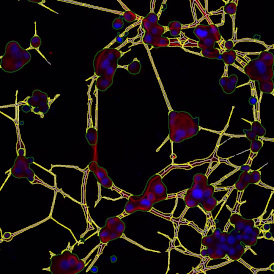
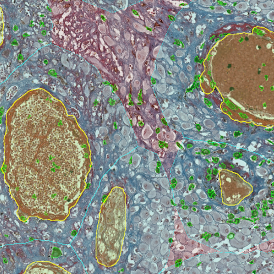
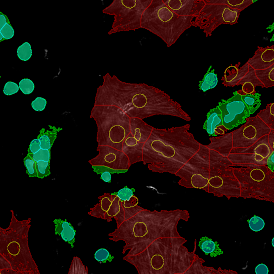
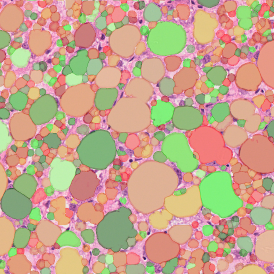
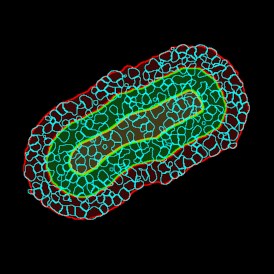
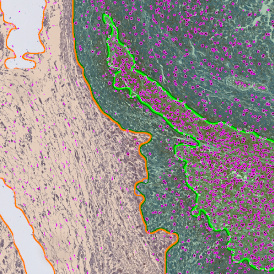
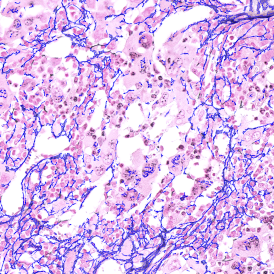
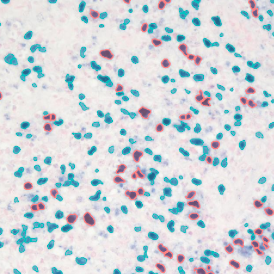
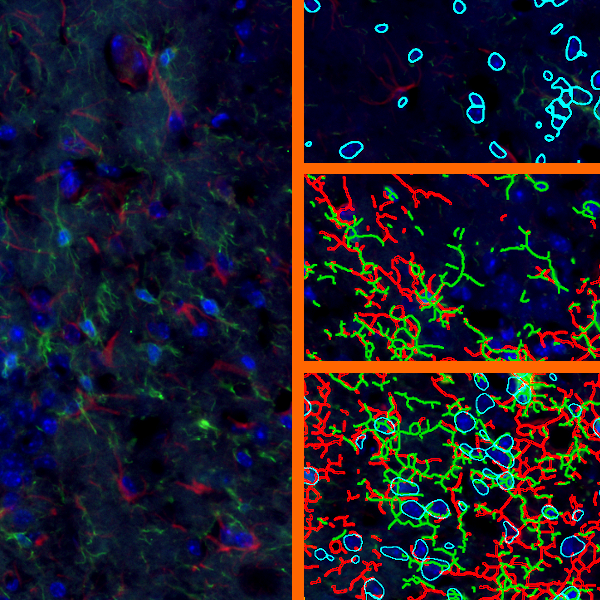
Overview of triple staining showing the nucleus in DAPI (blue), the housekeeping gene (green) and HER2/neu (red).


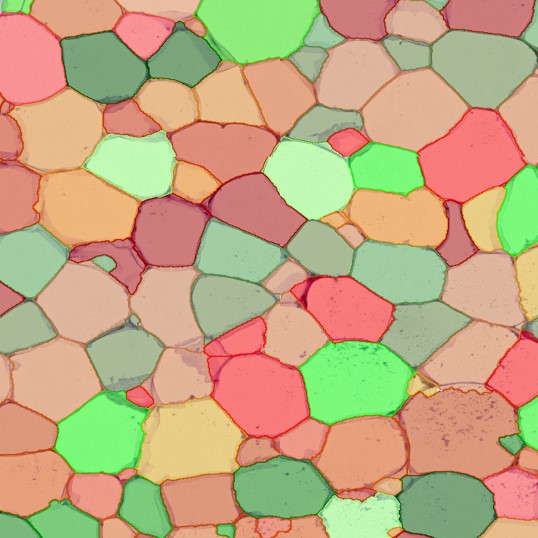
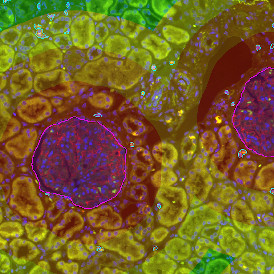
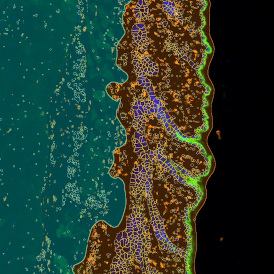
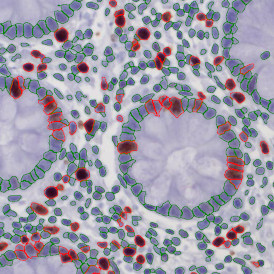
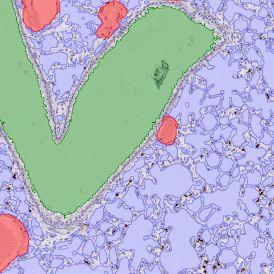
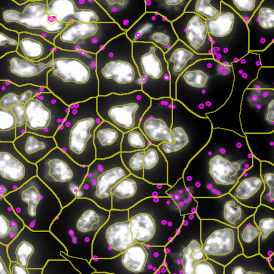
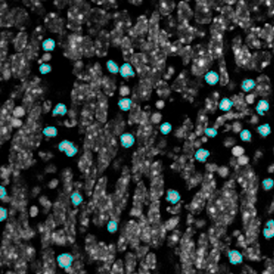
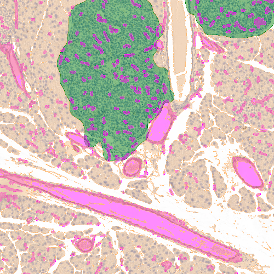
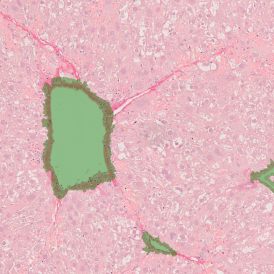
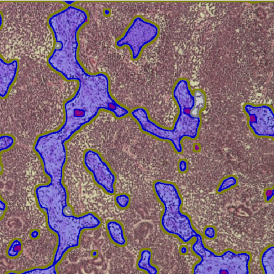
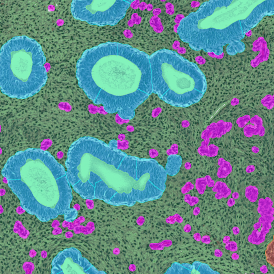
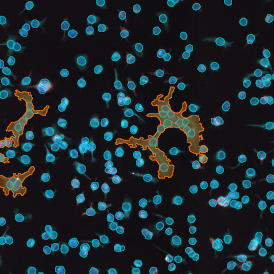
Selection of suitable nuclei by size and compactness.

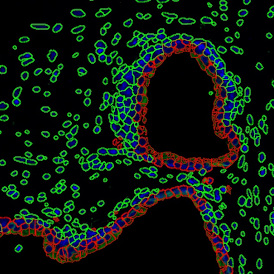
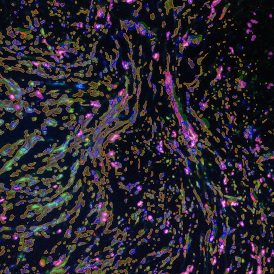
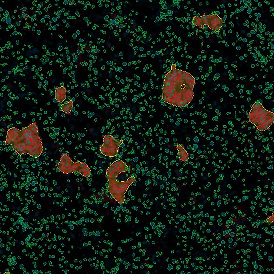
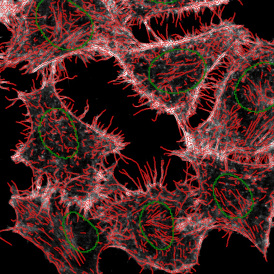
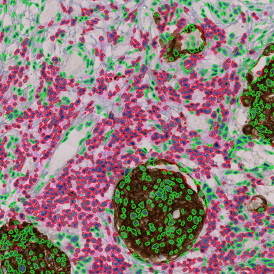
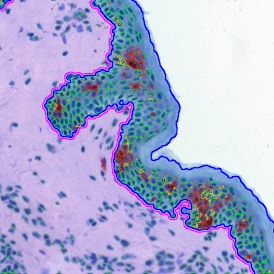
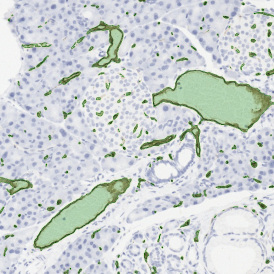
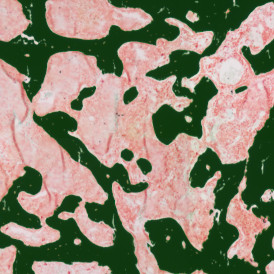
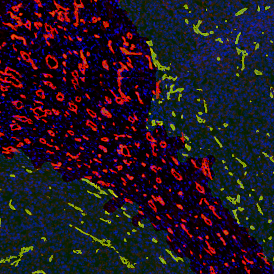
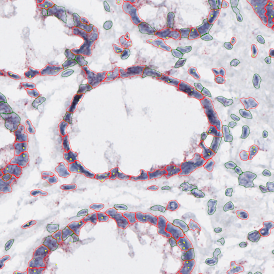
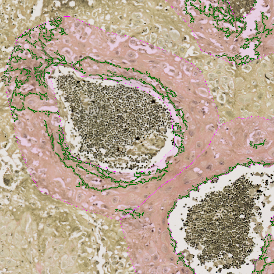
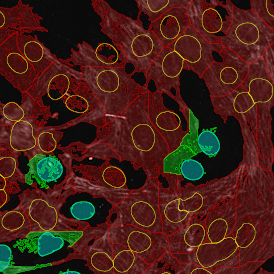
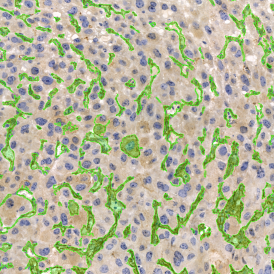
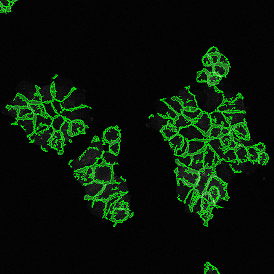
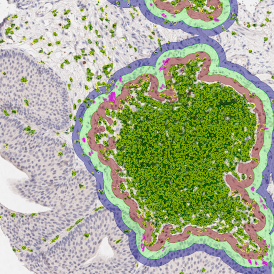
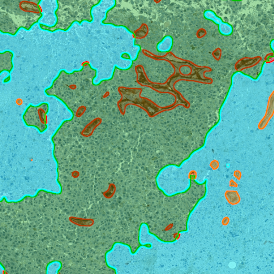
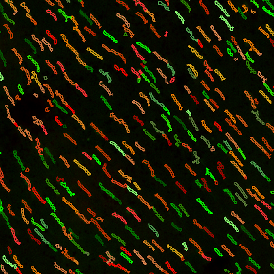
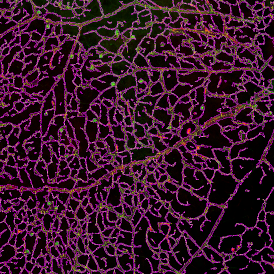
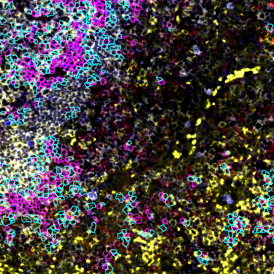
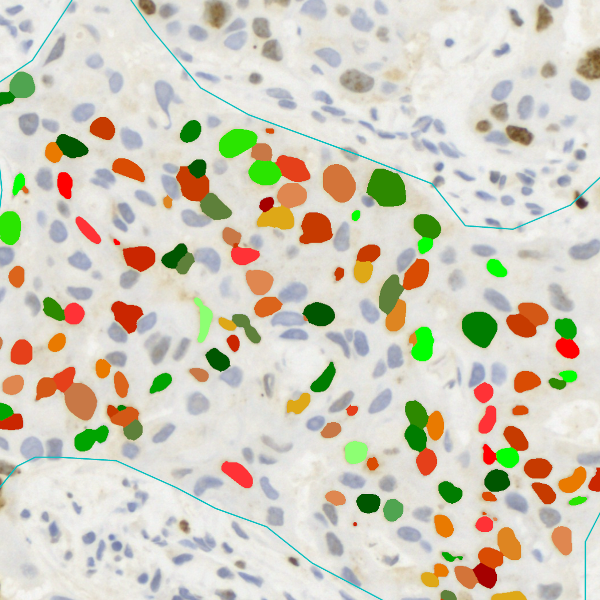
Detection of green housekeeping gene signal is shown in yellow in the right image and the detection of red HER2/neu signal in yellow in the left image.


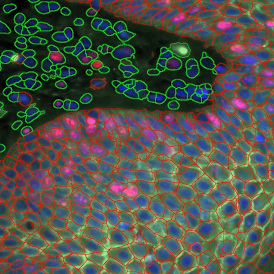
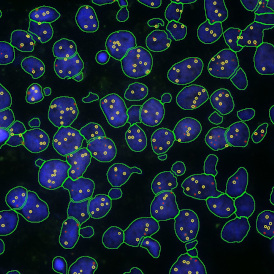
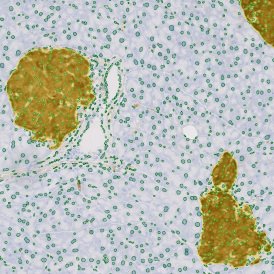
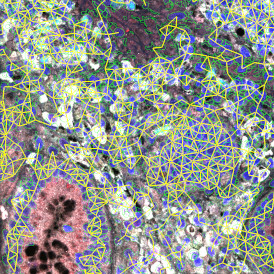
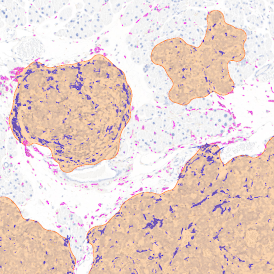
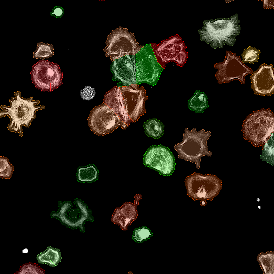
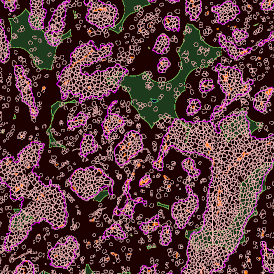
Cells with a 3 to 2 dots ratio (only one in this image) are shown by backward gating from the "3 x 2" gate.

FISH dot can be displayed and exported in two ways, as shown below. Scattergrams showing the number of cells with each dot number combination is useful, especially with the Heat Map function enabled which shows those groups with more cells. For the immediate export of data for pathology applications a special table view showing 16 parameters is provided (shown partially on the right side) which offers export to Excel, CSV and PDF formats.